Most “what AI can build” demos stop at a landing page. This is the opposite. To see how far Claude Code really goes, we used it to build a demanding website: an interactive 3D globe of regulations across more than 200 global territories, where you click any country to open a full, data-rich page of its own. No template could express this. It’s real code, in a real framework, and a solo builder got the first working version live in about a week. Here’s what that week looked like, and what it tells you about the ceiling.
What we set out to build
The brief was the hard end of the spectrum. Not a few static pages, but a data product:
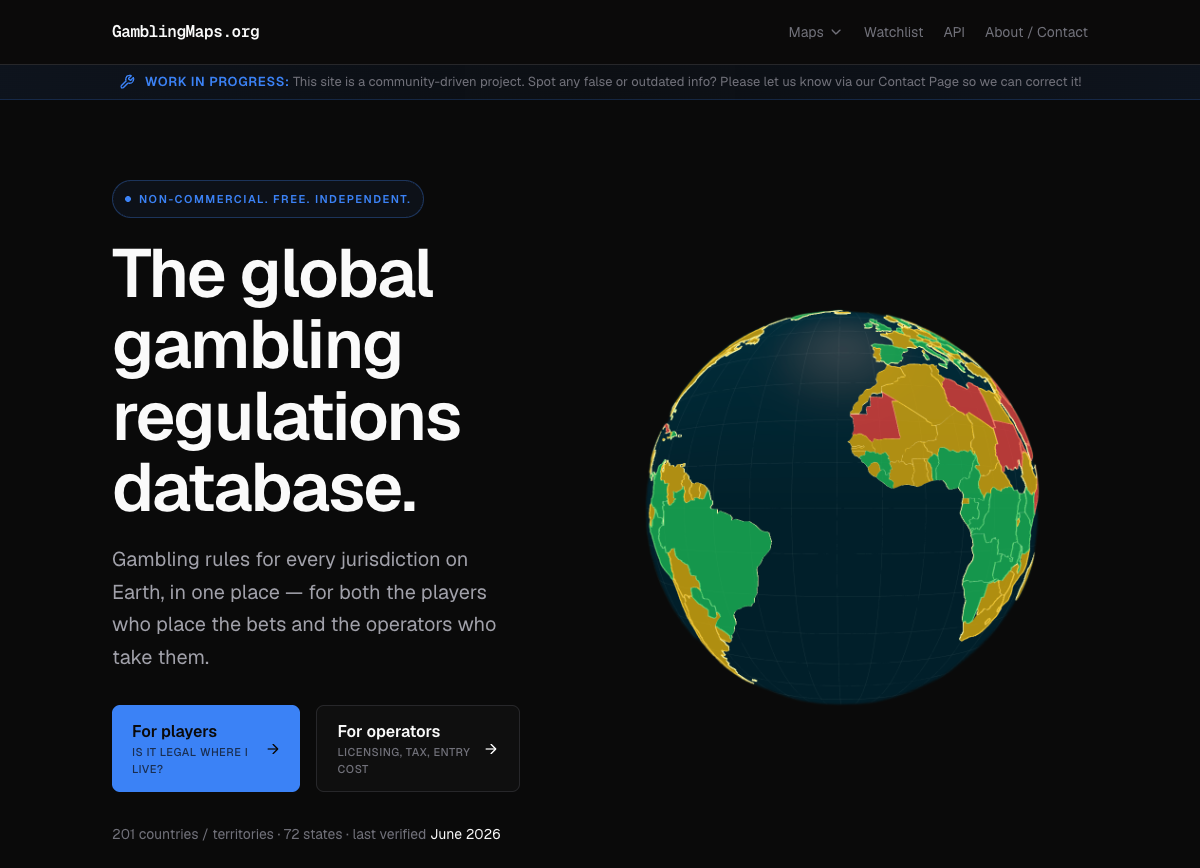
- A real 3D globe you can spin, with every country coloured by its regulatory status.
- A dedicated page for each of 200-plus countries and territories, generated from a structured data set, with the regulator, taxes, rules, and source citations.
- Drill-down from big countries into their states, because places like the US set rules state by state.
This is the kind of site you’d normally assume needs a developer and weeks of work. That’s exactly why it’s a good test of Claude Code.
What a week actually gets you
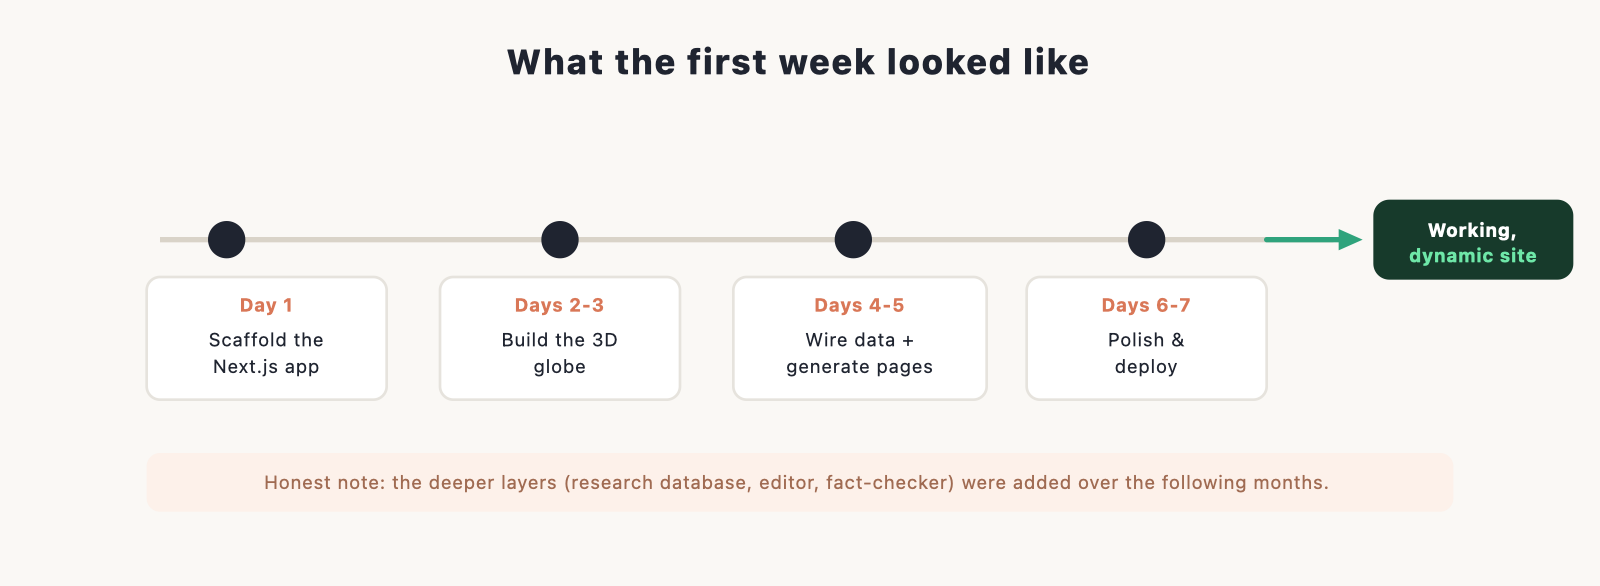
Here’s the honest version, because it matters. The first working version, the globe rendering all 200-plus countries, the per-country pages generating from the data, the whole thing deployed and live, came together in about a week. The deeper layers that make it a serious reference tool, a large research database behind it, an editing system, an automated fact-checker, were added over the months that followed.
So “in a week” doesn’t mean a toy. It means a real, dynamic, data-driven website that already does the hard thing, with depth added later. For most people’s projects, that first week is the whole site.
The centrepiece: a real 3D globe
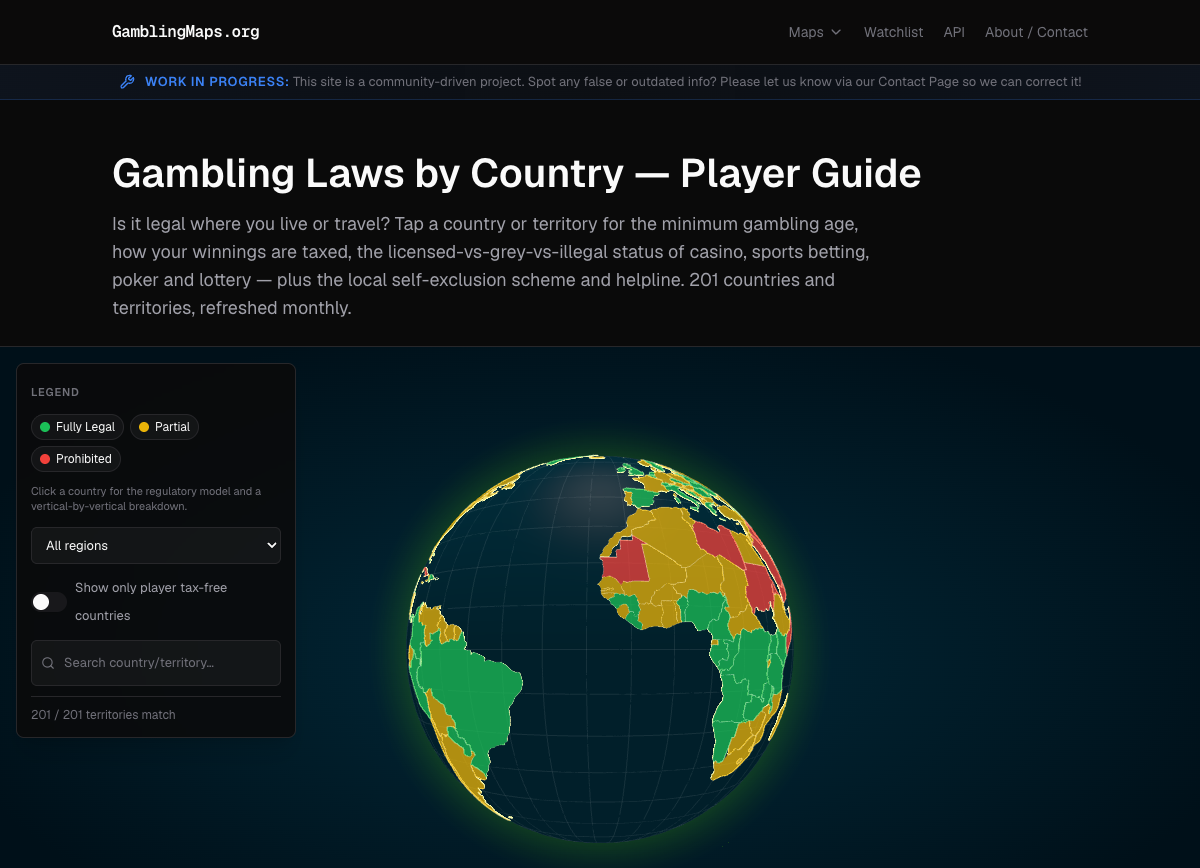
The map is a true 3D WebGL globe, not a flat image or an SVG chart. It spins, it’s interactive, and each country is painted by its status, green for fully legal through to red for prohibited, with the colours coming straight from the underlying data so it draws instantly. A globe reads as a product, not a diagram, and that was the point. Building this by hand would be a project in itself; with Claude Code it was a series of plain-English requests and reviews.
Dynamic pages, generated from data

This is what separates a data-driven site from a stack of static pages. Every country page is the same template filled from a structured record, so 200-plus pages come from one well-built page and a clean data set, not 200 hand-made files. Each one carries the regulator, the tax treatment, the status of each kind of gambling, the local programmes, and inline citations to sources. Update the data, and the page updates. That is the part a template-based builder simply can’t do.
The stack: what was actually used
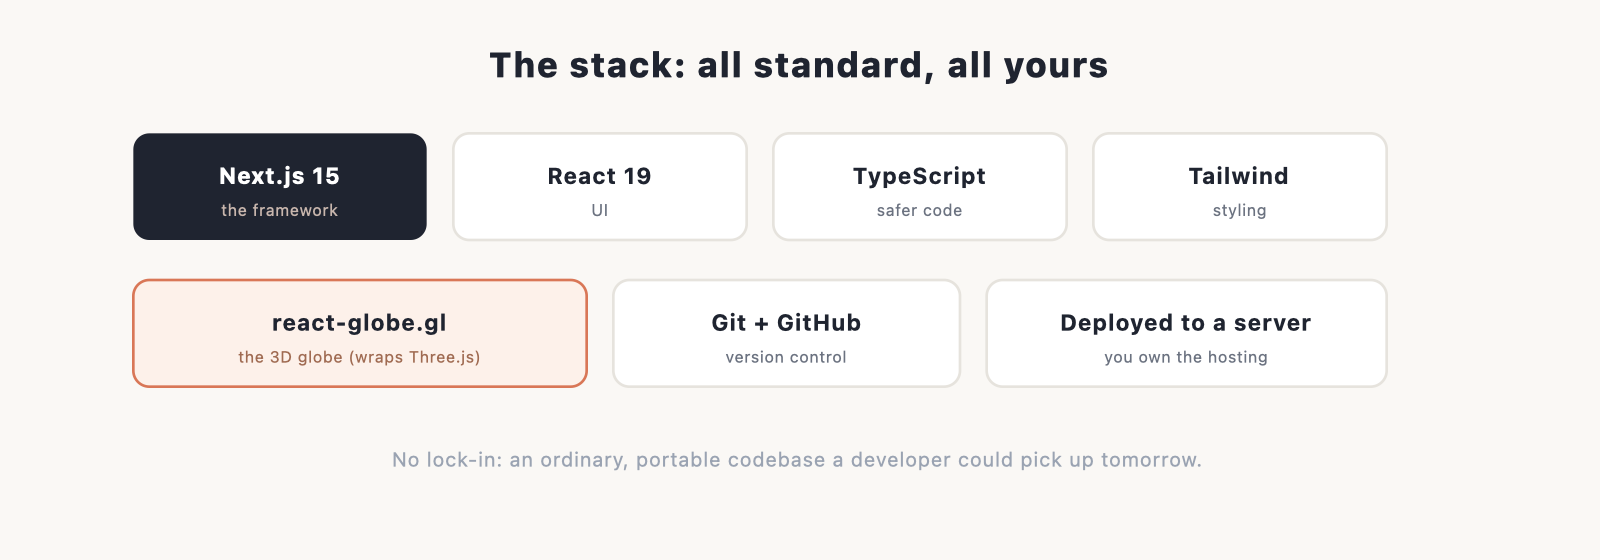
Nothing exotic, and all of it standard and owned. The site is built on Next.js 15 with React 19 and TypeScript, styled with Tailwind, with the globe powered by react-globe.gl (which wraps Three.js). It’s version-controlled with Git and deployed to a plain server. Every piece is an ordinary, portable part of the modern web stack, which means there’s no lock-in: it’s a normal codebase a developer could pick up tomorrow.
How it was built: the rhythm
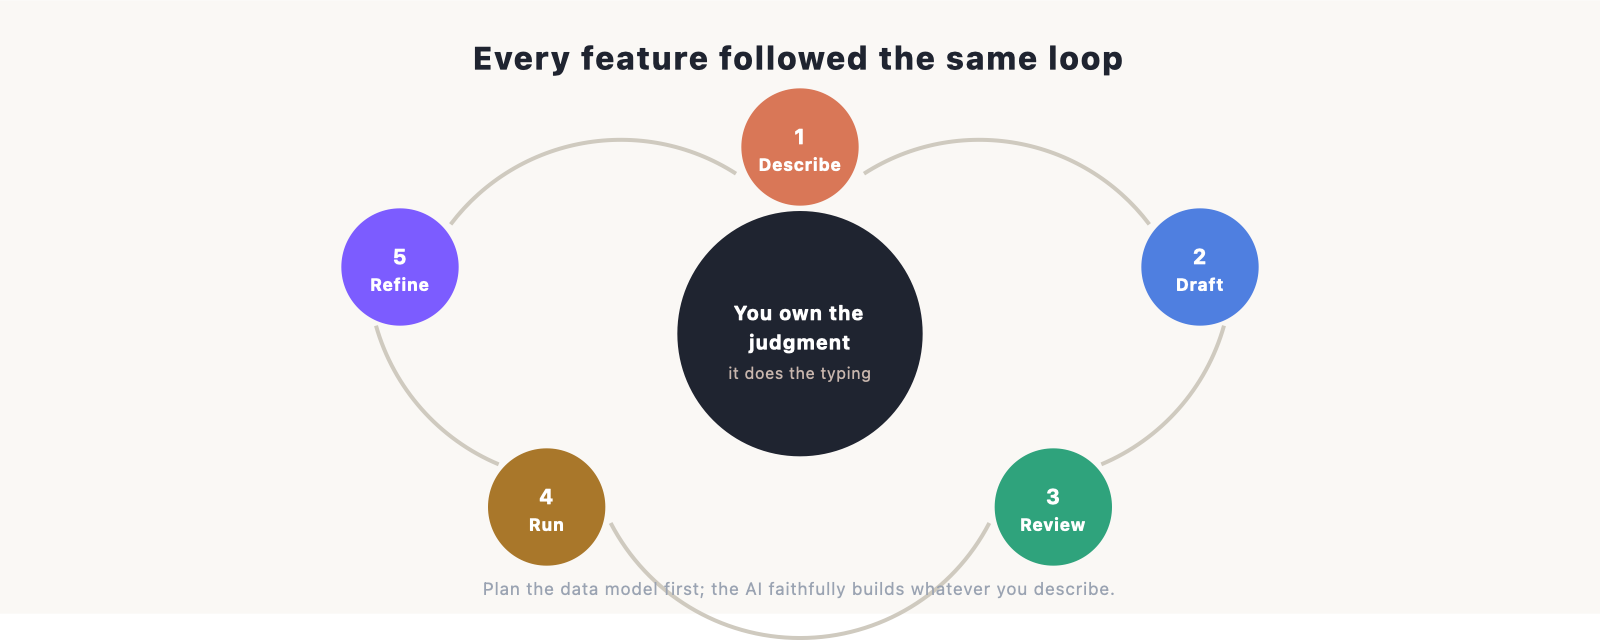
Every feature, large or small, followed the same loop, and it’s the loop you’d use for any site:
- Describe what you want, in plain English. “Paint each country by its status.” “Add a page template that fills from a country record.”
- Claude Code drafts the change across however many files it needs, and shows you exactly what changed.
- You review the diff and accept it, reject it, or redirect.
- It runs the site so you can see the change live.
- You refine. “Make the legend a filter.” “That tax figure is wrong.” Repeat.
You direct and review; Claude Code does the typing. The single biggest lever on quality was planning the data model first, since the AI faithfully builds whatever you describe, so describing the right structure up front beats reworking it later.
The honest part
A proof piece owes you the caveats too.
- You have to review the work. Claude Code is fast and usually right, but where a wrong number has consequences, every change gets read. Keep writing and reviewing as separate passes.
- Plan your data model before you prompt. For a data-driven site, the structure is the product. Decide where the truth lives first.
- Build before you deploy. A check that passes nowhere but your own machine will bite you. A quick lint, type-check, and build before pushing is not optional.
- Rich features have a cost. A 3D WebGL globe is heavier on a phone than a simple image. It was worth it here; weigh it for your case.
None of these are reasons not to build this way. They’re the difference between a demo and something you’d actually trust.
What this proves
The takeaway isn’t “AI builds websites now.” It’s that the ceiling is far higher than a landing page. If one person can get a dynamic, data-driven site spanning 200-plus countries, with a real 3D globe and a generated page for every jurisdiction, working in about a week, then “what can I build with this?” has a much bigger answer than most people assume.
If you want to try the same path, our main Claude Code guide walks through building and launching a site, the install guide gets you set up in about ten minutes, and the build a portfolio tutorial is the easiest first project. If a builder is more your speed for a simpler site, our comparison of Claude Code vs Lovable lays out the trade-off.
Frequently asked questions
Was the whole site really built in a week? The first working version was: the globe, the data-driven country pages, deployed and live. The deeper research database, editing system, and automated fact-checking were added over the following months. A week gets you a real, dynamic site; depth accrues after.
Do you need to be a developer to build something like this? Not a senior one, but you need to read code well enough to review what the AI writes and reject what’s wrong. Claude Code handles the authoring; you own the judgment.
What was the hardest part? Not the code, the data model. For a data-driven site, deciding how the information is structured is the real work. Get that right and the pages and the map follow.
Could a no-code builder do this? No. A builder is great for presentation, a marketing or brochure site. The moment you need a real data model, custom interactions like a 3D globe, and generated pages, you’ve passed what a template can express. That’s the line where Claude Code earns its place.
What did it cost to build? A Claude plan and ordinary hosting. Because the output is a normal codebase you own, there are no per-seat platform fees. See our Claude Code cost guide for the breakdown.